Last Updated on January 21, 2021 by Prabhakar A
The world is evolving rapidly, and so the technology is surprising us with the innovations. When it comes to advancement, digital marketing is no exception that is now turning out as data-driven marketing. Yes, that’s true!
The data listed in spreadsheets, dashboards, and several reports are the base of the marketing industry. No matter whether it’s a data of a small agency or a large business firm, recording and managing the data on Excel spreadsheets or Powerpoint eats plenty of time and attention of an individual. No doubt, it’s a hectic and time-consuming task. Right?
Know more: How to Convert Excel File to Outlook Address Book
Luckily, there’s a solution that will take you out of this not-ending tunnel trouble. The solution is Google Data Studio, a popular tool that works great in creating an impressive dashboard in minutes.
The tool presents your complex set of data to stakeholders, clients, or your team in a very understandable and easy manner. It can handle a ton of data records with complete ease, accuracy, and efficiency. So, if you’re a digital marketer, you must get started with this tool. It’s a must-have tool!
Let’s go through the Google Data Studio concept and know what it is, why you need it, and everything you want to scroll through about it.
Table of Contents
What is Google Data Studio?
Google Data Studio is a powerful data visualization, reporting, and communication tool that helps create an interactive report that is easy to understand, share and read by an individual. Released in 2016 as a part of Google Analytics 360 Suite, and in 2018, it’s free version became accessible.
The tool is user-friendly and intuitive that doesn’t even require programming knowledge to create data reports.
As this is a drag and drop tool, you can easily pull the data from various sources, including Google Analytics, Google My Business (GMB), YouTube Analytics, Google Sheets, Google Ads, Display & Video 360, Search Ads 360, and BigQuery.
See more: 10 Most Important Features of Web Analytics
After accessing the data from sources, you can share it with your clients or team members. The free version of Google Data Studio allows the user to share the report with clients and make changes (if they’re given editing rights).
How to Use Google Data Studio?
Now you are aware of what Google Data Studio is, let’s take our topic to another level discussing how to use Google Data Studio.
1. Get Started
As we have also discussed earlier, Google Data Studio is a free tool, so all you need to get started with is Google Account. If there is any incurred fees, then it would be only for accessing your data source. Big Query is a perfect example of it as they charge for some requests.
Using Google Data Analytics turns out fun. Just create a Google account to sign it up and enjoy the benefits associated with this tool.
2. Make Your First Report
Once you logged in to Data Studio, you will see a broad tool interface that looks like Google Docs. When you click the Template Gallery button, pre-loaded templates will appear on the screen.
Although you can choose any template, it is good to start with a Blank Report to learn more about this tool. Click “Blank Report,” and then the “Get Started” button on a new pop appears.
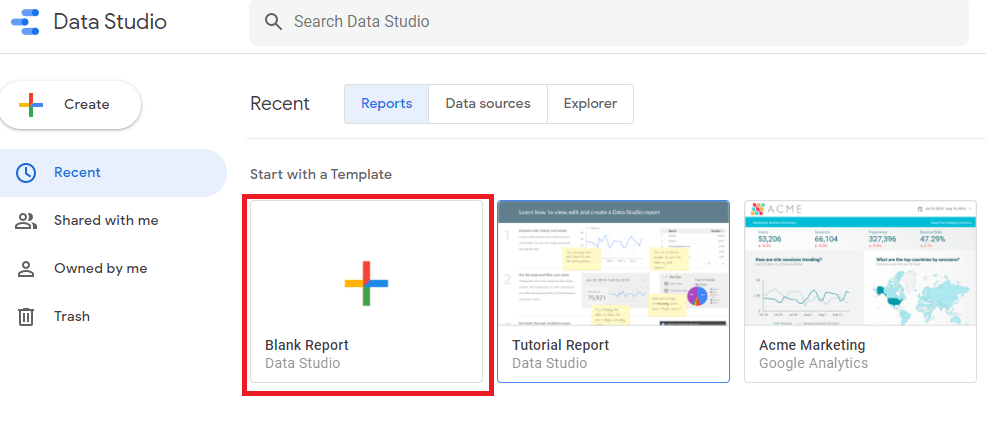
Check for the Agree checkbox and click “Accept” to continue. To make your first report, click on the Blank Report template and add your report title.
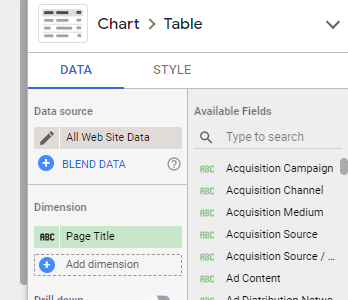
3. Connect a Data Source
The next step in Google Data Studio is connecting your report to a new data source. Google Docs and Google Analytics are one of the easiest data sources you can use. Click on the Add Data in the toolbar, and you’ll find 17 different connectors. Choose the one you want to use.
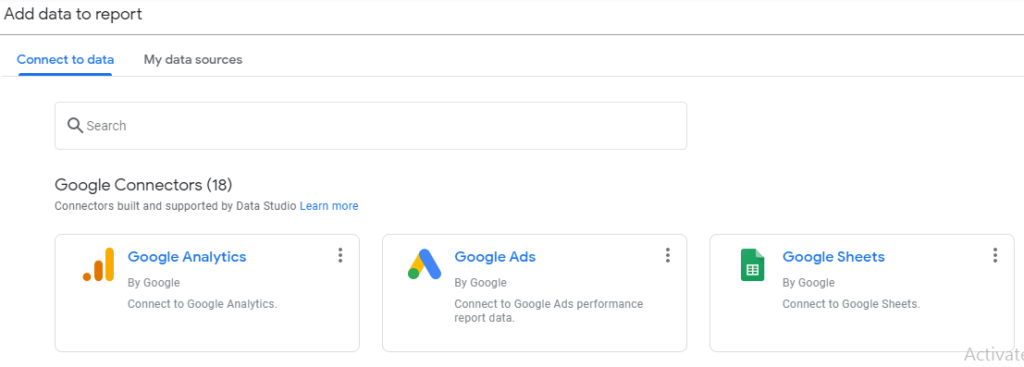
To understand this concept in-depth, we choose Google Analytics. For first-time use, it is necessary to authorize Google to access the data. Just click on Authorize and then Allow button to proceed.
Read more: What Is a Google Crawl Budget and How to Optimize Them?
After the authorization process, select account, property, and view. Click the Connect tab, and you will see the tab in the upper left-hand corner.
4. Set the Date Range
When you select the Google Analytic source, you will see the data dimensions and metrics. Select the data (can be edit, add and remove anytime) you want to add to your report and click the Add button.
5. Dashboard Overview
The Data Studio dashboard consists of the following:
- Menu: This option consists of File, Edit, View, Page, Arrange, Resource, and Help tabs.
- Toolbar: It lists out the elements like Charts, Themes, and Layouts, Text, URL Embedding, Shapes, and Lines, along with Add Data.
- Canvas: Give ease to create and edit your report.
- Sidebar: Display various options corresponding to the element you have selected from the canvas.
- Share: Offer the ease of sharing your report.
- View: This tab helps you to view your report.
6. Adding Charts
Click “Add a Chart” in the toolbox option, and various types of charts will get display on the screen. You can add the type of chart to your report that suits your requirements. Let’s talk about a few charts (considering Google Analytics sample data here):
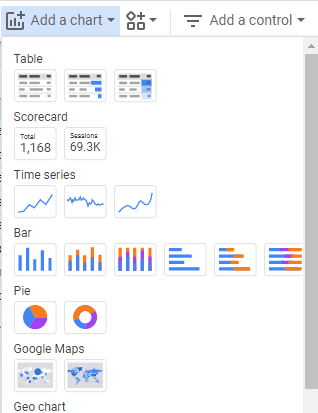
- Scorecard: This type of chart is used to represent the KPIs in your Google Analytics report.
- Geo Map: It allows you to represent your data in different shades of color or color combinations.
- Time Series: This type of chart helps in data representation like site visits, number of page view, number of clicks, etc.
- Pie Chart: This chart divides the data into different sets of users, basically based on gender, age, and other factors.
- Bar Chart: A bar chart is used to represent a variety of data.
7. Create Interactive Reports
Google Data Studio features several advanced options that help in creating interactive reports.
- Filter Control: This feature allows viewers to focus on distinct subsets of data in your report.
- Date Range Filter: With this Data Studio feature, you can allow a viewer to select a time frame for the report. It means the viewer can go through the data for a particular time duration.
- Data Control Filter: This feature allows your clients or a third party to view the report, and this is possible with the use of a set of data they have access to. Let’s take an example- If you create a Google Analytics report for a website “A” and share it with a client adding a data control, the client can easily view that report for “A” website. If your client has access to another website, “B,” they have the complete authority to share the report for website “B” too.
Presently, Google Data Studio supports only six types of data controls, including Google Analytics, YouTube Analytics, Google Ads, Campaign Manager, Search Console, and Google Ad Manager 360.
Know more: What is Google Gravity
8. Sharing Report
After creating your report, share it with your team members or clients, selecting one of the in-built sharing options from the dropdown Share tab located on the upper right-hand side. The dropdown tab includes options –
- Invite People
- Schedule Email Delivery
- Get Report Link
- Embed Report
- Download Report
Final Words
Google Studio is one of the most popular data reporting tools that nowadays, many digital marketers embrace for better results. This tool is easy to use, needs no programming knowledge, and is loaded with user-friendly features, making it a perfect tool to rely on for most digital marketing and data handling needs.
About the author: Ravi is the Founder & CEO of Web Design Melbourne, a One-Stop Digital Agency based in Melbourne that specialises in Web Design. He helps businesses to increase their online presence with the help of engaging websites.
Comments
0 comments